

 المنهج السعودي
 المنهج العراقي
 المنهج المصري
Make a temperature graph - Connect Plus Primary 2 Term 2 - ثاني ابتدائي
you will need
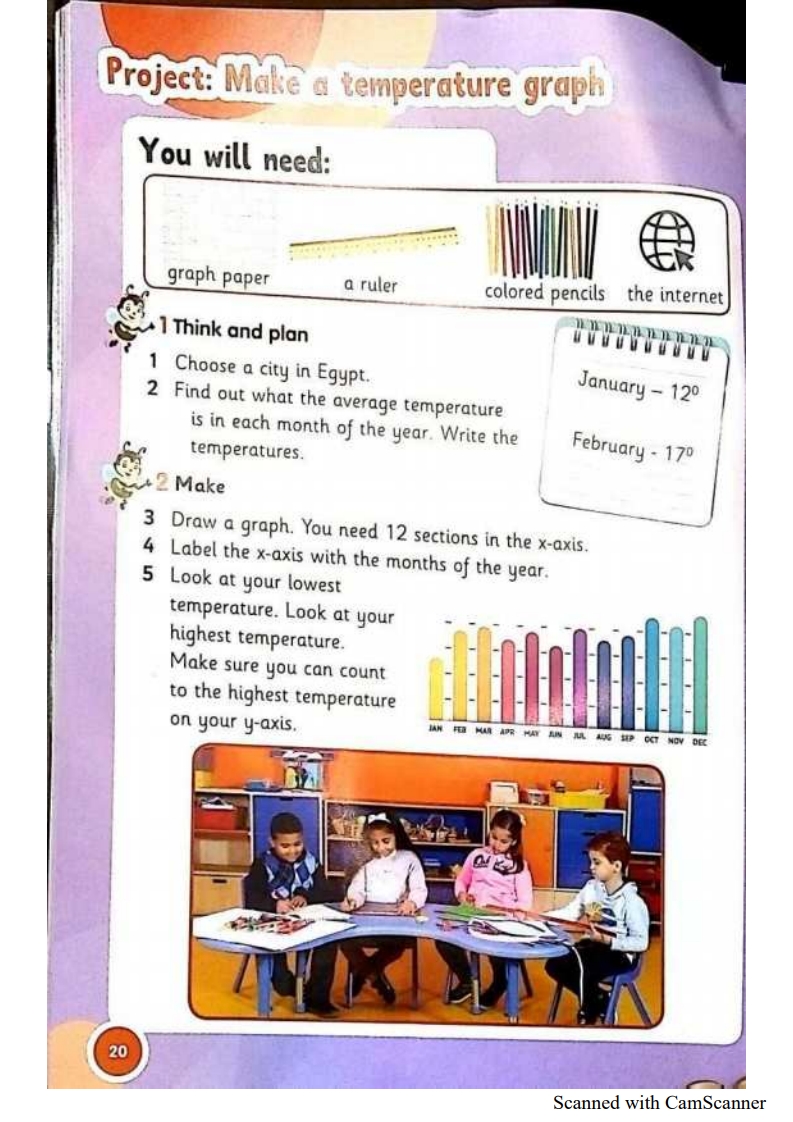
Project: Make a temperature graph You will need: 1 Think and plan graph paper a ruler colored pencils the internet January - 12° February - 17º 1 Choose a city in Egypt. 2 Find out what the average temperature is in each month of the year. Write the temperatures. 2 Make 3 Draw a graph. You need 12 sections in the x-axis. 4 Label the x-axis with the months of the year. 5 Look at your lowest temperature. Look at your highest temperature. Make sure you can count to the highest temperature on your y-axis. JAN FEB MAR APR MAY AN AUG SEP OCT NOV DEC 20 Scanned with CamScanner
you will need
شرح you will need
make
شرح make
التعليقات
الرجاء تسجيل الدخول لكتابة تعليق.

لا تعليقات بعد. كن أوّل من يكتب.