

 المنهج السعودي
 المنهج العراقي
 المنهج المصري
Make a temperature graph - Connect Plus Primary 2 Term 2 Activity Book - ثاني ابتدائي
look at the graphs
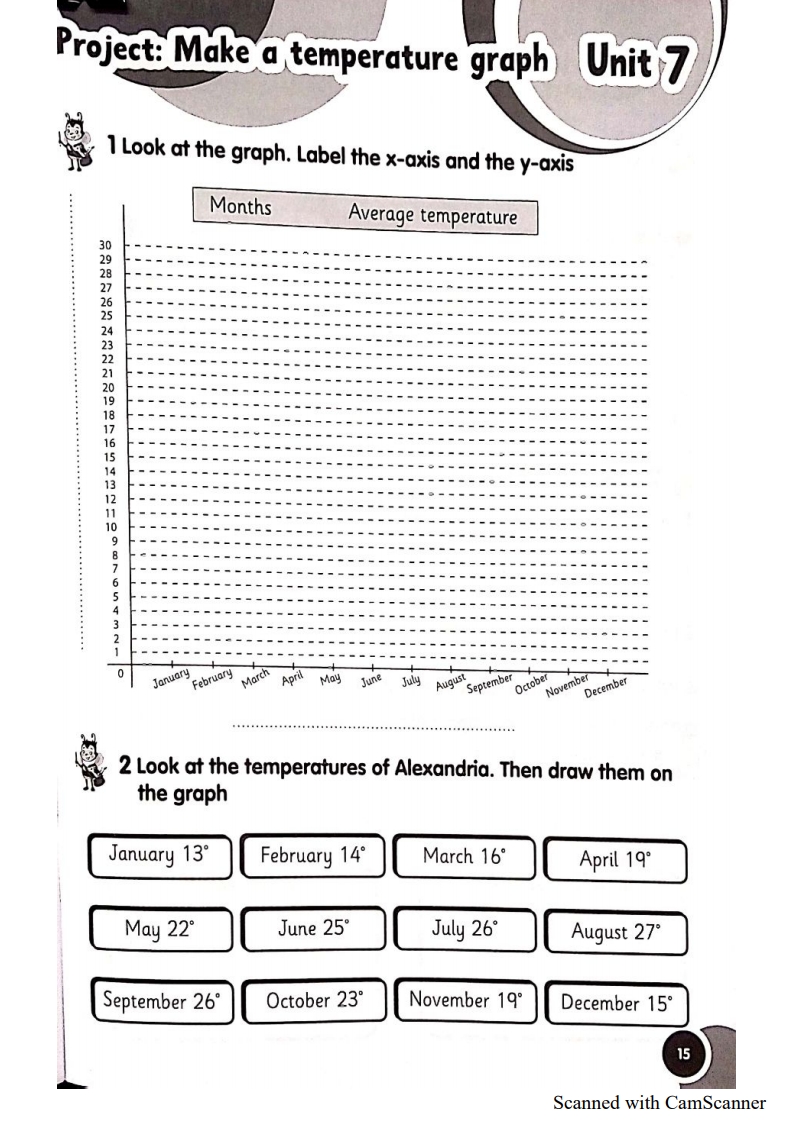
Project: Make a temperature graph Unit 7 1 Look at the graph. Label the x-axis and the y-axis Months Average temperature January February March April May June July August September October November December 2 Look at the temperatures of Alexandria. Then draw them on the graph January 13° February 14° March 16° April 19° May 22° June 25° July 26° August 27° September 26° October 23° November 19° December 15° 15 Scanned with CamScanner
look at the graphs
شرح look at the graphs
look at the temperatures of Alexandria.then draw them on the graphs
التعليقات
الرجاء تسجيل الدخول لكتابة تعليق.

لا تعليقات بعد. كن أوّل من يكتب.